

A Companion Article to Risk Management is Performance Management
Acknowledgement
This article is inspired by and derived from the work of Nico Snyman at Crest Advisory Africa, whose published research on risk matrix mathematics identifies the structural fault described here and proposes the corrected additive scoring model on which the Axiom Risk matrix is based. The original article is published at crestadvisoryafrica.com. The application of that model within the Axiom Risk methodology, and its integration into the closed calculation chain, is the contribution of this article.
Introduction
The 5×5 risk matrix is the most widely recognised tool in enterprise risk management. It appears in board reports, audit committee packs, and regulatory submissions across virtually every sector and jurisdiction. Most risk practitioners have used one. Most governance bodies have reviewed one. The format is so familiar that its mathematical foundations are rarely examined.
They should be.
The standard implementation of the 5×5 matrix multiplies a likelihood score (1 to 5) by an impact score (1 to 5) to produce a risk score between 1 and 25. The logic appears sound: higher likelihood and higher impact should produce a higher score. Multiplication achieves that. What multiplication also achieves, less visibly, is a set of structural problems that undermine the matrix as a governance instrument.
This article identifies those problems, presents the corrected additive model developed by Nico Snyman at Crest Advisory Africa, and explains how the Axiom Risk matrix applies that model within a broader methodology in which the matrix serves as a visual output layer rather than a calculation engine.
The Multiplication Problem
Collision: 25 Positions, 14 Scores
A 5×5 matrix has 25 grid positions. If those positions are scored by multiplying likelihood by consequence, the result set is not 25 unique values. It is 14.
Consider the multiplication table:

The scores 20, 15, 12, 10, 8, 6, 5, 4, 3, and 2 each appear in more than one grid position. Score 12 appears at (L3, C4) and at (L4, C3). Score 6 appears at (L2, C3) and at (L3, C2). Score 4 appears at (L2, C2), (L4, C1), and (L1, C4).
Eleven of the 25 grid positions share their score with at least one other position. The matrix claims to assign a unique numeric value to each risk position. It does not.
Equivalence That Is Not Equivalent
The collision problem has a practical consequence that matters.
A risk rated at likelihood 2 and consequence 3 (score: 6) is arithmetically identical to a risk rated at likelihood 3 and consequence 2 (score: 6). Both appear at the same position in the heat map. Both trigger the same appetite threshold. Both receive the same treatment priority.
They are not the same risk.
The first risk is less frequent but more damaging when it occurs. The second is more frequent but less damaging. Their treatment strategies, monitoring cadence, and control priorities should differ materially. The multiplication model cannot distinguish between them. It assigns them the same score and places them in the same cell. A risk that occurs three times a year and causes moderate harm is treated identically to one that occurs twice a year and causes greater harm. The format conceals a meaningful governance difference.
This is not a rounding artefact or an edge case. It is a structural feature of the multiplication model that affects a significant proportion of the matrix.
The Distribution Problem
The collision issue would be serious on its own. The distribution problem compounds it.
Multiplying integers from 1 to 5 does not produce a uniform distribution. It produces a distribution that is heavily skewed toward the low end of the scale.
Twelve of the 25 grid positions in a standard 5×5 multiplicative matrix produce scores of 6 or below. Nearly half the matrix occupies the bottom quarter of the numerical range. The top of the scale (scores above 16) is occupied by only 5 grid positions, all in the upper-right corner. The practical result is that most of the register clusters at the low end of the scale regardless of the actual spread of risks, because the scale itself is compressed there.
This matters for governance. A matrix that concentrates most positions in a narrow low-value band, while leaving the high-value positions sparse, does not give a board a useful visual picture of the risk landscape. It gives them a picture shaped by arithmetic, not by actual risk distribution.
The Governance Consequence
Crest Advisory Africa’s validation analysis of the standard multiplicative model quantifies the fault in terms that translate directly to governance accountability. The analysis, published by Nico Snyman at Crest Advisory Africa, maps the collision and distribution problems against the governance levels at which different score ranges are typically used, and produces the following finding: the standard 5×5 multiplicative model is correct for only 56% of the 25 grid positions. The fault factor is 44%.
That overall figure becomes more concerning when the score range is split by the governance level at which decisions are made.
Scores in the range 1 to 10 correspond broadly to operational-level risk decisions. At this level, the multiplicative model performs at 90% accuracy: 10 of 11 positions in this range carry a unique score. A 10% fault at the operational level is material but bounded.
Scores in the range 11 to 19 correspond to tactical-level decisions: those affecting operational programmes, resource allocation, and management-level treatment responses. At this level, the model performs at 33% accuracy. Two in every three positions in this range share their score with at least one other position. The tactical register, where management is actively making prioritisation and treatment decisions, is built on a model that is wrong more often than it is right.
Scores in the range 20 to 25 correspond to the decisions made at board and executive committee level: the risks that represent the most significant threats to organisational objectives, require formal treatment responses, and carry the highest governance consequence if mismanaged. At this level, the multiplicative model performs at 17% accuracy. Five of the six positions in this range are affected by collisions. The governance body responsible for the most consequential risk decisions is working with a scoring model that produces a correct, unique score for only one in six of the positions at which those decisions are made.
These figures are Crest Advisory Africa’s: the analysis and its conclusions are Nico Snyman’s contribution, and the numbers are reproduced here with attribution. The point they establish is not that practitioners are failing. The point is that the standard tool, applied correctly and in good faith, produces structurally unreliable outputs at the governance levels where reliability matters most.
The Corrected Model: Additive Scoring
The corrected model, developed by Nico Snyman at Crest Advisory Africa, addresses both problems by replacing multiplication with an additive approach that assigns a unique integer from 1 to 25 to every grid position in the matrix.
The scoring follows a diagonal distribution: scores increase consistently along the diagonal axis from the low-likelihood, low-consequence corner to the high-likelihood, high-consequence corner. The resulting matrix is:
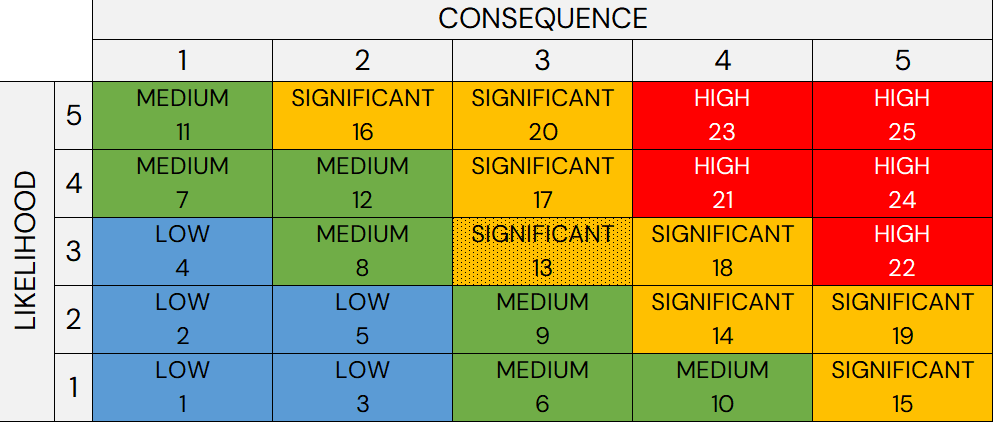
Every grid position carries a unique integer. There are no collisions. The score at (L2, C3) is 9. The score at (L3, C2) is 8. Two risks with the same total of likelihood plus consequence are no longer arithmetically identical: their positions on the matrix reflect their actual profile.
The distribution is also corrected. Scores are spread across the full range from 1 to 25, with the diagonal structure ensuring that the gradient from low to high is progressive and continuous rather than compressed at one end. The visual output of the matrix accurately reflects the spread of positions rather than forcing most risks into a narrow band.
This is the matrix that Axiom Risk implements.
Why the Matrix Fault Matters Less Than It Seems (and More Than It Seems)
At first reading, the multiplicative fault might appear to be a technical footnote: a mathematical curiosity with limited practical impact. If everyone is using the same matrix, the relative positions of risks within the register still reflect their comparative severity. Is the fault material?
It is, for two reasons.
The first is the equivalence problem. If a governance body is making treatment prioritisation decisions based on register scores, any two risks that share a score are, by definition, competing for the same priority. The multiplicative model creates false equivalences: risks with genuinely different profiles that require different governance responses are placed in the same position and treated as interchangeable. The additive model removes those false equivalences. Every position is distinct, and treatment decisions are made on the basis of genuinely differentiated scores.
The second reason is the governance credibility problem. The Crest Advisory Africa validation analysis establishes that the fault is not evenly distributed: it is concentrated precisely where governance stakes are highest, at tactical and board level. A register that a board is using to make the most consequential risk decisions of the organisation is a register where the underlying scoring model produces a correct and unique output for fewer than one in five of the positions in that decision range.
That is not a technical footnote. It is a defensibility problem. A register that cannot explain why two materially different risks carry the same score, or why the scoring scale performs least reliably at the top end, cannot hold up under sustained audit or regulatory scrutiny. The corrected model closes that gap. The mathematics is sound, documented, and explainable.
The fault matters less than it seems when viewed in isolation. It matters more than it seems when viewed as part of a governance instrument that is expected to hold up under challenge.
How Axiom Risk Uses the Corrected Matrix
The Axiom Risk matrix implements the corrected 1-25 additive scoring model in a role that is deliberately different from the traditional one.
In a standard ERM implementation, the matrix is the calculation engine. An analyst estimates a likelihood score and a consequence score. Those two estimates are multiplied (or, with the corrected model, looked up in a table). The result is the risk score. The matrix performs the calculation.
In Axiom Risk, the matrix is the output layer. It does not perform the calculation. The risk score, which Axiom Risk terms the Residual Risk Score (RRS), is produced by a mathematically closed calculation chain that flows from control assessments through contributing factors to the risk level. The chain is described in full in the companion white paper, Risk Management is Performance Management. What matters here is that the RRS arrives at the matrix already calculated. The matrix’s job is to display it.

This means the two axes of the Axiom Risk matrix, labelled Likelihood and Consequence for governance recognition, are not independently estimated inputs. They are reference axes that give the board a familiar visual frame for interpreting the RRS position. A risk with an RRS of 17 appears at position (L4, C3) on the additive matrix because that is the grid position assigned the value 17. The analyst did not estimate a likelihood of 4 or a consequence of 3: the calculation chain determined the score, and the matrix places it.
The practical implication is significant: because the matrix position is driven by RRS, and RRS is driven entirely by control performance, the heatmap is a live picture of control performance across the register, displayed in a format that governance bodies immediately recognise. When a control assessment deteriorates, the risk moves up the matrix automatically. When controls improve, the risk moves down. No analyst re-rating is required. No judgment re-entry point exists.
The matrix in Axiom Risk is not where the calculation happens. It is where the result of the calculation becomes visible.
A Note on Likelihood as Contextual Information
One consequence of the Axiom Risk approach is that likelihood, as an independently estimated score, does not enter the calculation chain. This is deliberate. Introducing a likelihood estimate would reintroduce a judgment point at which an analyst’s opinion, rather than measured control performance, influences the residual score. The white paper addresses this in full.
Likelihood is not discarded in Axiom Risk. It is retained as a contextual indicator on the risk record: a declared frequency band that informs assessment cadence, monitoring intensity, and risk description, without entering the formula. A risk described as Almost Certain in its likelihood indicator is assessed and reviewed more frequently than one described as Rare. The likelihood indicator informs the governance conversation; it does not drive the score.
For practitioners accustomed to likelihood as a scoring input, this can feel like a departure from familiar practice. It is. The departure is deliberate. The goal is a residual score that reflects the state of the controls, not the analyst’s combined estimate of how frequently the risk might occur and how severe it would be if it did. Those estimates are useful context. They are not a defensible basis for a governance number.
Summary
The standard 5×5 multiplicative risk matrix has two structural mathematical problems: it produces only 14 unique scores from 25 grid positions, creating false equivalences between materially different risk profiles, and it generates a non-linear distribution that clusters most risks at the low end of the scale regardless of their actual spread. Crest Advisory Africa’s validation analysis, published by Nico Snyman, quantifies the overall fault factor at 44%, and demonstrates that the fault is concentrated at the governance levels where it matters most: 67% at tactical level, and 83% at board and executive level.
The corrected additive model, developed by Nico Snyman at Crest Advisory Africa, resolves both problems by assigning a unique integer from 1 to 25 to every grid position along a diagonal distribution. Every position is distinct. The distribution is progressive across the full range. The mathematics is defensible.
Axiom Risk implements this corrected matrix as the output layer of a closed calculation chain. The matrix displays the Residual Risk Score produced by control performance measurement. It does not estimate it. The visual format is familiar. The number behind it is derived, not judged.
A board reviewing an Axiom Risk heatmap is looking at a familiar governance tool with a fundamentally different foundation. That distinction, between a score that was estimated by an analyst and a score that was derived from control evidence, is the argument this article makes and the argument the full white paper develops in detail.
For the full methodology, including the calculation chain from Control Effectiveness Rating to Residual Risk Score, refer to the companion white paper: Risk Management is Performance Management.
This article may be shared freely. The Axiom Risk methodology, base architecture, and system documentation are the intellectual property of Digital Marque.


